Kubernetes
How to collect metrics in a Kubernetes cluster
This blog post is part of a Kubernetes series that will help you initiate Observability within your Kubernetes cluster.

Henrik Rexed
Dec 16, 2021
5 minute read


This blog also summarizes the content presented on the “Is it Observable” episode: how to collect metrics in K8s, briefly explaining:
-
1
The core components of Kubernetes
-
2
The architecture of Prometheus
-
3
The default Prometheus exporter that will help you collect relevant metrics on K8s
If you're working in the cloud-native space, there is a big chance that you're eating K8s for breakfast, lunch, and dinner.
A few years ago, the entire market was looking at the new kid on the block called Kubernetes…but at that time, nobody was betting on the current usage and popularity of the technology.
Kubernetes has become the standard technology for Cloud-native architecture.
In reality, it’s an orchestration tool that manages our workload by starting, updating, and deleting pods.
But how is Kubernetes able to do magic tricks on our environment?
Well, to answer this question, we need to look at the engine:
# The core components of Kubernetes
Kubernetes runs on nodes. A node is technically a server: physical or virtual.
Kubernetes has two distinct types of nodes :
<iframe width="560" height="315" src="" title="YouTube video player" frameborder="0" allow="accelerometer; autoplay; clipboard-write; encrypted-media; gyroscope; picture-in-picture" allowfullscreen></iframe>
-
Master Node
-
Worker Node
A master node is a central component managing the entire cluster. If you're using a Kubernetes cluster managed by one of the cloud providers, you probably won’t have access to the master node.
On the other hand, the worker nodes are the layer that will be used to deploy our pod for our workload.
Let’s have a look at the core that we find in those two types of nodes:
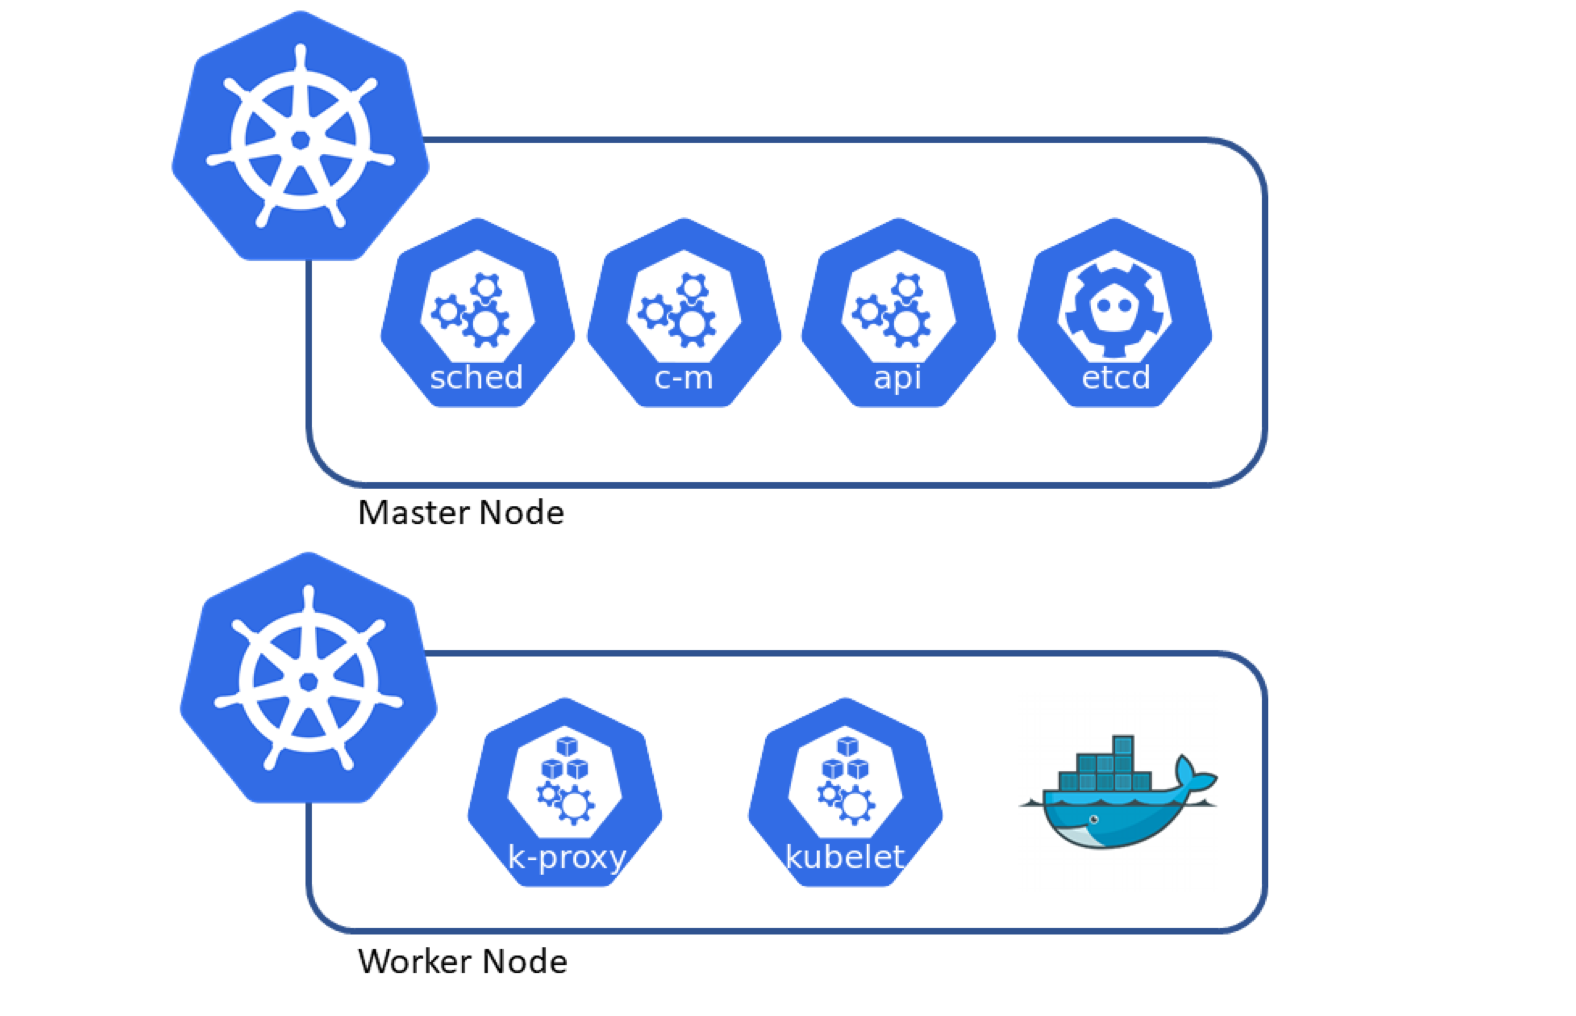
# Master node:
-
The scheduler is the component that is responsible for selecting the node that will be in charge of hosting our workload. The scheduler will select the node based on resource utilization, taints, quotas, …etc.
-
The Control Manager is responsible for detecting the state changes of our workload. If a pod crashes, it will try to reschedule the pod to make sure we always have the desired number of pods running in our cluster. The control manager doesn’t schedule pods by itself, it will reach out to the scheduler to delegate that task.
-
Etcd is a key-value pair storage that stores the status of our various Kubernetes components
-
The APi server is a very important layer because it allows us to deploy our workload utilizing the HTTP request or kubectl ( that is interacting with the API)
# Worker node
-
Container runtime: since Kubernetes orchestrates containers within your cluster, the node needs to have a container runtime. Most of us use the docker runtime.
-
Kubelet: Once the scheduler has identified the node to run our workload, kubelet is in charge of allocating resources and running our pods. It is also responsible for validating that our pods are ready and healthy. Kubelet will report any state changes of our pod to the control manager.
-
Kube-proxy is the component in charge of the communication between services.
All those components have specific tasks to make sure that we always have the desired number of pods in our environment. If we want to make sure that Kubernetes is running under good conditions, we will need to make sure to collect information related to:
-
The health of the nodes
-
The status of the workload
To collect metrics related to our Kubernetes cluster, we will naturally take advantage of Prometheus, which has become standard for this.
So, let’s have a look at the architecture of Prometheus.
-
The retrieval component in charge of collecting metrics from the various Prometheus exporters
-
Storage that stores the metrics collected in a time series database.
-
An HTTP server that provides a simple UI to build our PromQL and an API endpoint that is used by Grafana to display the metrics
# The Alert manager in charge of raising alerts based on rules defined in Prometheus.

The Prometheus core components will only provide the feature to:
-
Collect metrics
-
Store metrics
-
Raise alerts
How can we expose metrics to Prometheus?
Prometheus needs to be configured by defining the various endpoints having metrics ( in a Prometheus format).
The metrics are produced by external solutions exposing data in the Prometheus format. Those solutions are named exporters.
The popularity of Prometheus is mainly related to a large number of exporters.
Today you can find exporters for many types of solutions :
-
Database
-
Hardware
-
Messaging
-
Storage
-
Others ( CICD solutions).
Prometheus also provides several clients in various languages that allow you to expose custom metrics in a Prometheus format.
Deploying the Prometheus operator with the help of the helm chart will also add:
# Grafana
# Several Prometheus exporters:
-
Kube-state metrics
-
Node exporter
-
Cadvisor
The other advantage of the Helm chart is that you'll have all the various components automatically configured. You only need to focus on:
-
Exposing Grafana out of your cluster (by using ingress or a service mesh like Istio)
-
Building or using an existing dashboard in Grafana
If you don’t reuse existing dashboards created by the community, I recommend having a look at:
Let’s have a look at the type of metrics that you'll be able to collect with the default exporters:
# Default exporters
Kube state metrics will report metrics related to workload scheduling:
-
node status, node capacity (CPU and memory)
-
replica-set compliance (desired/available/unavailable/updated status of replicas per deployment)
-
pod status (waiting, running, ready, etc)
-
resource requests and limits.
-
Job & Cronjob Status
With the help of Kube state metrics we would be able to create a Promql that will report:
-
The ratio of a pod in a running state
Sum by (node) (kube_pod_status_phase:{phase =”Running” }) /sum by ( namespace) (kube_pod_status_phase) *(100)
-
The ratio of pods having a cpu limit defined
Count by (namespace) (kube_pod_container_resource_limits: {ressource=”cpu”}) /sum by ( namespace) (kube_pod_status_phase:{phase =”Running” }) *(100)
Node exporter
The Node exporter will focus on our nodes' hardware and operating system metrics.
You'll easily be able to build a Promql Based on the node exporter metrics to report:
-
The memory usage in % of our node :
(sum by (node) (node_memory_MemTotal_bytes — node_memory_MemAvailable_bytes) / sum by (node ) (node_memory_MemTotal_bytes))*100
-
CPU ioWait
avg(rate(node_cpu_seconds_total{mode=\”iowait\”}[$interval])) * 100
# Conclusion
With the help of the steps described in the Is It Observable episode, you'll be able to install Prometheus and build your first dashboard.
From the moment you're working with Kubernetes, you'll be able to take advantage of all the default exporters and dashboards built by our community.
Metrics are only one angle to observe your Kubernetes cluster properly.
In the next episode, we will cover how to ingest logs and how to consume Kubernetes events
Table of Contents
Topics
Go Deeper
Go Deeper


