Kubernetes
How to autoscale in Kubernetes and how to observe scaling decisions
Autoscaling is the process that dynamically scales up or down any component of your Kubernetes architecture. HPA and VPA are two types of autoscalers you can use.

Giulia Di Pietro
Jul 04, 2022
10 minute read


On the Is It Observable blog and YouTube, you have already covered many topics related to Kubernetes, like how to collect metrics, logs, and more. In this article, you'll focus on how to autoscale your workload and observe its behavior.
First, I'll introduce the concept of autoscaling and how it works in k8s. Then you'll look at the metrics server, HPA, and VPA. Finally, we will finish with a tutorial on how to use HPA and VPA.
# Introduction to autoscaling in k8s
Autoscaling is a process that dynamically scales up or down any components of your architecture.
When it comes to Kubernetes, you can scale:
-
The number of required nodes of our cluster
-
Or the number of pods required to run your application properly based on the current usage.
Here’s an example of good use of autoscaling:
You may have a situation where the load on your website increases only at the end of the day, which means you may need additional web servers to handle the surge in traffic. But what about the rest of the day? Your servers can't sit and do nothing during most business hours. You want to optimize the potential cost of our environment, especially if you're utilizing a cloud provider.
Autoscalers enable you to increase the number of components in case of a spike and scale down when the situation returns to normal.
# Types of autoscalers for Kubernetes
In Kubernetes, there are several autoscalers available:
-
Vertical Pod Autoscaler (VPA)
-
Horizontal Pod Autocscaler (HPA)
-
Cluster AutoScaler
Each of those autoscalers scale up or down k8s objects based on metrics, thus making it rely on the metric server of Kubernetes.

# The Kubernetes metric server
So, what is the k8s metric server?
As you all know, Kubernetes schedules the workload based on resource definition: CPU or memory request. The request helps k8s to manage the resource available within the cluster.
It defines how many resources you need to start the pod, but nothing blocks you from consuming more resources unless there are limits. Limits on memory or CPU fix a hard limit on how much your pod can technically consume in our cluster.
For autoscaling scenarios using HPA and VPA (explained in detail below), Kubernetes requires understanding how many resources pods are currently consuming. For this use case, k8s requires a metric server in the kube-system namespace.
If you're working with a managed k8s cluster, your cloud provider deploys the metric server for you. To manage your cluster, you need to deploy the metric server in the kube-system namespace.
This component is there to understand the current resource utilization of pods and nodes in the cluster. This notion of utilization is key to helping k8s schedule new workloads.
The metric server collects kubelet and makes them available in the k8s API.
Here is the link to the deployment of the metric server: https://github.com/kubernetes-sigs/metrics-server
The metric server isn’t designed to be an observability solution because for observability, you need a reliable solution that has long data retention to understand a current situation (i.e., Prometheus, Dynatrace, etc.)
The Metrics Server is not meant for non-auto scaling purposes. For example, don't use it to forward metrics to monitoring solutions or as a source of monitoring solution metrics. Please collect metrics from the Kubelet /metrics/resource endpoint directly in such cases.
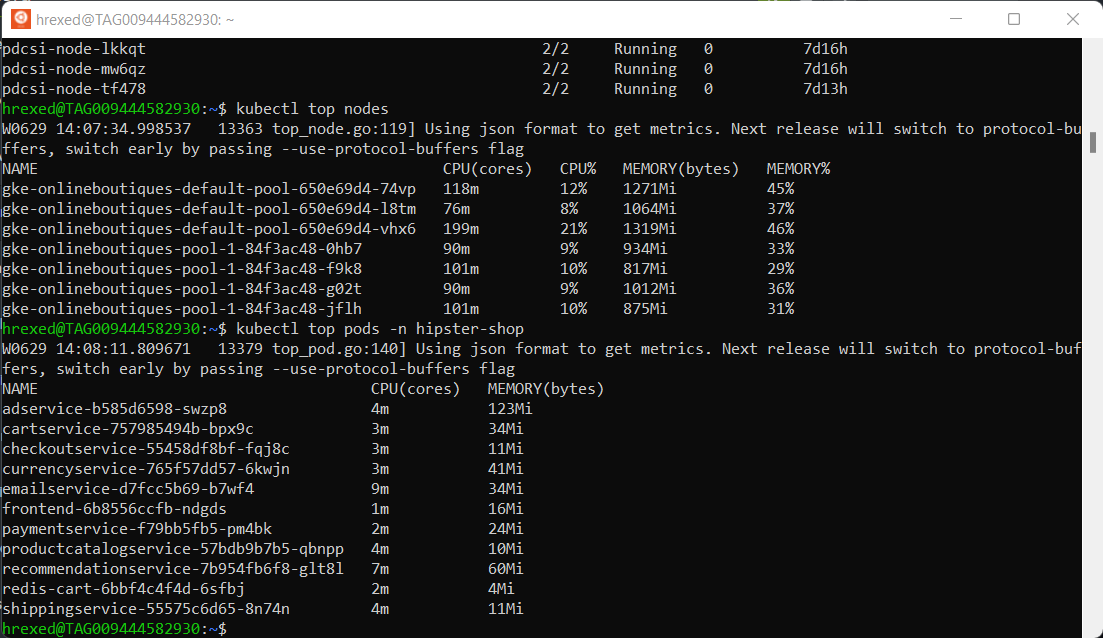
The metrics collected by the metric server can be viewed with the command kubectl top pods or kubectl top nodes (for a given namespace).
These APIs are designed to serve different types of metrics:
-
Resource Metrics API: predefined resource usage metrics (CPU and memory) of Pods and Nodes
-
Custom Metrics API: custom metrics associated with a Kubernetes object
-
External Metrics API: custom metrics not associated with a Kubernetes object
As a result, all the autoscaling scenarios you may want to implement will require the metric server. As you can see, if you want to build more precise rules based on metrics other than CPU and memory, you'll need external or custom metrics.
You need the metric server, the solution itself, and the adapter to take advantage of custom and external metrics provided by a solution like Prometheus.
The adapter is a component that helps the metric server to query the data from the source. Several types of adapters are available, like the Prometheus adapter and the Azure adapter.
To be able to take advantage of your custom metric with the metric server, you need to:
-
Explore the metrics you would like to use for our autoscaler use case (building the right promQL, looking at the available labels exposed by the metric).
-
Try to identify labels that can be associated with a k8s object: namespace, node, pod, etc.
-
Then create the proper configuration file for your adapter to match your metric.
Let’s have a look at the configuration file of the adapter:
rules:
# this rule matches cumulative cAdvisor metrics measured in seconds
- seriesQuery: '{__name__=~"^container_.*",container!="POD",namespace!="",pod!=""}'
resources:
# skip specifying generic resource<->label mappings, and just
# attach only pod and namespace resources by mapping label names to group-resources
overrides:
namespace: {resource: "namespace"},
pod: {resource: "pod"},
# specify that the `container_` and `_seconds_total` suffixes should be removed.
# this also introduces an implicit filter on metric family names
name:
# you use the value of the capture group implicitly as the API name
# you could also explicitly write `as: "$1"`
matches: "^container_(.*)_seconds_total$"
# specify how to construct a query to fetch samples for a given series
# This is a Go template where the `.Series` and `.LabelMatchers` string values
# are available, and the delimiters are `<<` and `>>` to avoid conflicts with
# the prometheus query language
metricsQuery:
"sum(rate(<<.Series>>{<<.LabelMatchers>>,container!="POD"}[2m])) by (<<.GroupBy>>)"
In the rule, two operators help to discover our metric: the seriesQuery and the seriesFilters.
If your metric provides many labels, you probably want to apply a filter to your query. In that case, you'll utilize seriesFilters.
For example:
# match all cAdvisor metrics that aren't measured in seconds
seriesQuery: '{__name__=~"^container_.*_total",container!="POD",namespace!="",pod!=""}'
seriesFilters:
- isNot: "^container_.*_seconds_total"
Where seriesFilter will apply a RegExp to filter only series with the right naming (or a name that doesn’t respect this RegExp) with the help of the operator:
-
Is
-
IsNot
Then, you need to map the labels that refer to Kubernetes objects, for example:
rules:
- seriesQuery: 'http_requests_total{kubernetes_namespace!="",kubernetes_pod_name!=""}'
resources:
overrides:
kubernetes_namespace: {resource: "namespace"}
kubernetes_pod_name: {resource: "pod"}
If all your labels have a consistent naming convention like kubernetes_pod, kubernetes_namespace, kubernetes_nodes…then you could create a template:
resources:
template: "kubernetes_<<.Resource>>"
And you can also change the name of your metric:
# match turn any name <name>_total to <name>_per_second
# e.g. http_requests_total becomes http_requests_per_second
name:
matches: "^(.*)_total$"
as: "${1}_per_second"
In this example, you rename the metric name …_total like http_request_total to http_request_per_second. You can't use any total metric from your auto-scaling scenarios, so we need to rename it to “per second” and adjust our PromQL.
Lastly, you need to specify the actual query you would like to apply. For example:
metricsQuery: 'sum(rate(<<.Series>>{<<.LabelMatchers>>}[2m])) by (<<.GroupBy>>)'
Suppose you're planning to use an Auto Scaling feature of Kubernetes. In that case, you'll probably need to use custom metrics to define precise auto-scaling decisions …and avoid scaling decisions only based on CPU or memory utilization.
Now, let’s have a look at the autoscalers mentioned above.
# The Horizontal Pod Autoscaler (HPA)
The Horizontal Pod Autoscaler scales the number of pods in a deployment. Statefulset, ReplicaSet based on CPU/Memory utilization or any custom metrics exposed by your application.
If you're using standard metrics (resources, CPU, and memory), the HPA auto-scaling algorithm will first check that all the pods have a request defined on the resource definition; it will collect the current and target usage defined in the HPA.
Therefore, if you aren’t defining requests on your workload, you won’t be able to benefit from auto-scaling features.
Each separate HPA exists for each deployment, statefulset, replicaset. The HPA object constantly checks their metrics against the Memory/CPU threshold you specify and keeps increasing/decreasing the replicas count. By using HPA, you'll only be paying for the extra resources when you need them.
HPA uses a specific algorithm related to resource usage:
desiredReplicas = ceil[currentReplicas * ( currentMetricValue / desiredMetricValue )]
The desired value is the request defined in our workload.
# Example
If I want to define a deployment with a request on the CPU of 200m, I will generate a load on this application. When I look at the CPU usage of my pod, I have 1300 m, and I have only one replica. Using HPA, I would have 7 replicas (1300/200).
# Creating metric-based rules
If multiple metrics are specified in a Horizontal Pod Autoscaler, this calculation is done for each metric, and then the largest of the desired replica counts is chosen. If any of these metrics can't be converted into the desired replica count (e.g. due to an error fetching the metrics from the metrics APIs) and a scale down is suggested by the metrics which can be fetched, scaling is skipped. This means that the HPA can still scale up if one or more metrics give a desiredReplicas greater than the current value.
# Scaling behavior
It’s also important to configure the scaling behavior. It defines how the pods will scale up or down. If you don’t define any custom behavior, k8s will use the default behavior:
behavior:
scaleDown:
stabilizationWindowSeconds: 300
policies:
- type: Percent
value: 100
periodSeconds: 15
scaleUp:
stabilizationWindowSeconds: 0
policies:
- type: Percent
value: 100
periodSeconds: 15
- type: Pods
value: 4
periodSeconds: 15
selectPolicy: Max
Note that the scaled-down policy is set at 100%, so in 15s, you can remove all the replicas to reach the minimum replica defined in your HPA.
The stabilization window is used to avoid changing the number of replica counts when the metrics used for scaling keep fluctuating. The auto-scaling algorithm uses this window to infer a previous desired state and avoid unwanted changes to the workload scale.
For example, in the following snippet, a stabilization window is specified for scaleDown.
behavior:
scaleDown:
stabilizationWindowSeconds: 300
When the metrics indicate that the target should be scaled down, the algorithm looks into previously computed desired states and uses the highest value from the specified interval. The above example will consider all desired states from the past 5 minutes.
# HPA deployment
HPA can be deployed using a manifest file describing how you want to implement your autoscaler.
Here is the definition of the HPA object:
apiVersion: autoscaling/v2
kind: HorizontalPodAutoscaler
metadata:
name: test-hpa
spec:
scaleTargetRef:
apiVersion: apps/v1
kind: Deployment
name: frontend
minReplicas: 1
maxReplicas: 5
metrics:
- type: Resource
resource:
name: memory
targetAverageUtilization: 60
-
scarTargetRef specifies which deployment / replica will be in the scope of this HPA
-
minReplicas define the minimum number of pods
-
maxReplicas define the max number of pods
-
Metrics will be the rule related to metrics available throughout the metric server. You define the type of metris: Containerresource, External, Objects , Pods, Resource
If the type is a resource, you'll need to define the resource object that refers to a resource metric (CPU or memory). The name can be either memory or CPU.
And then the target, so either averageUtilization or averageValue.
averageUtilization: the average utilization across all the relevant pods, would be a percentage of the requested value
averageValue: the target value of the average metric across all the relevant pods.
You can also define HPA by simply using kubectl autoscale command:
Kubectl autoscale -n hipster-shop deployment front-end --CPU-percent=50 --min=1 --max=10
# The Vertical Pod Autoscaler (VPA)
VPA is designed to adjust the size of your pods based on the actual usage by increasing the request/limits settings.
Like HPA, VPA relies on the metric server to make the right decision.
There are several ways of using it:
-
Auto: which automatically adjusts the pods' definition by recreating the pod (only possible if you have more than one replica)
-
Recreate: to be used only to ensure that the pods are restarted whenever the resource request changes
-
Initial: only assign resource request on pod creation, never applied changes later
-
Off: no auto update on the resource, the suggested value will be available in the description of the VPA.
Using VPA in Auto mode on all your workloads could bring you some surprises because VPA will evict the pods to change the resource definition. If you apply VPA on all your workloads, you may have a downtime window to restart all your pods. If you're planning to do so, it’s recommended to limit the impact by using the PodDisruptionBudget (PDB).
You can create a PodDisruptionBudget (PDB) for each application. A PDB limits the number of Pods of a replicated application that are down simultaneously due to voluntary disruptions.
            apiVersion: policy/v1
kind: PodDisruptionBudget
metadata:
  name: zk-pdb
spec:
  minAvailable: 2
  selector:
  matchLabels:
  app: zookeeper*
In the podDisruptionBudget you'll define how many replicas need to be available on a workload matching the label selector.
Consequently, k8s will start new pods before evicting to guarantee that you always have the minimum available pods for our workload.
# The VPA architecture
Here is the architecture of the VPA:

It deploys:
-
The VPA controller that hosts 2 components: recommender and updater
-
The VPA admission controller
-
And the historical storage that consumes events and metrics over time to make the right decision
Every time there is a new deployment, it goes through the VPA controller, checking if any VPA is defined for this workload. The admission control overrides the container's resources in the pod with the settings provided by the recommender.
The updater is in charge of updates on the pods (with VPA in auto mode)
# Goldilocks project
There is a really interesting project named Goldilocks that will automatically deploy VPA ( so make sure to remove your existing VPA to take advantage of goldilocks) in all the namespaces that have been labeled.
You can configure the deployed VPA in recommendation mode. Goldilocks provides a dashboard showing all the various recommendations.

# How can we observe HPA and VPA?
VPA and HPA are smart ways to adapt your replica and pod size based on usage, but you have no feedback on the behavior of the autoscaling mechanism.
To keep track of:
-
HPA: the metrics used to trigger your HPA definition and report the number of pods running for your deployment,
-
VPA: of the CPU/Memory request and limits.
# Tutorial: Autoscaling in Kubernetes
In this tutorial, you'll use HPA and VPA and look at the events generated by those two autoscalers.
For this tutorial you'll need:
-
A Kubernetes cluster
-
A metrics server deployed
-
Prometheus
-
The Prometheus adapter
-
The demo application
-
VPA and HPA
Head over to my YouTube channel to follow every step in the tutorial:
Or follow the steps on GitHub: isItObservable/Autoscalers--HPA-and-VPA: Tutorial related to the episode : Autoscalers- HPA and VPA (github.com)
Go Deeper


