Traces
Introduction to OpenTelemetry
OpenTelemetry is an open-source project for observability, which aims to establish a platform-neutral standard for traces and metrics.

Giulia Di Pietro
Jan 20, 2022
7 minute read


OpenTelemetry, a.k.a. OTel, is a key part of observability since it allows you to collect traces, metrics, and logs from your systems to help you understand why issues may be happening. This is crucial, especially in complex microservices and cloud-native systems, where human beings can’t track every single transaction traversing your architecture.
If you want to understand why your system is slow or why you're generating errors, then this article is for you!
In this blog post, we will dive into all you need to know about OpenTelemetry, covering the following topics:
-
Introduction to OpenTelemetry
-
The types of data collected by OpenTelemetry
Traces
Metrics
Logs
-
The various components of OpenTelemetry
Collector
Client library
This is also a summary of my video on my YouTube channel from the Kubernetes series, which you can watch here: Introduction to OpenTelemetry.
# What is OpenTelemetry?
OpenTelemetry is a collection of tools, APIs, and SDKs, that allows you to instrument, generate, collect, and export telemetry data. However, it is not a backend solution like Prometheus or Jaeger (more to that in the next section). It’s open source and vendor-neutral, with an active and thriving community.
Its name was born as a combination of two words:
-
Open = open source
-
Telemetry = coming from Greek
Tele = remote
Metry = measurements
OpenTelemetry was born from the merger of two already-existing open source projects, OpenTracing and OpenCensus, both created to support gathering traces and metrics. OpenTelemetry is backward compatible with all integrations from both projects.
Dealing with OpenTelemetry in your project requires two distinct steps:
-
Generating the data from your code
-
Storing and consuming the collected data
# Why OpenTelemetry?
There are already multiple observability platforms that can provide a drill down in your code and show you traces (like Dynatrace, NewRelic, DataDog, etc.) - so why do you need OpenTelemetry?
OpenTeletry resolves one big pain: creating a standard to report and transmit measurements.
If you use OpenTelemetry with solution A, you can easily change your observability platform to solution B. Without losing any history of your traces.
Now, OpenTelemetry has become the standard for many companies that are implementing observability in their systems.
# OpenTelemetry Data Collection
In describing what OpenTelemetry does, I’ve mentioned traces, metrics, and logs. Though they're common words in this domain, their meaning isn’t self-explanatory. So, let’s have a detailed look at what they mean to understand them better.
# What is a trace?
The OpenTelemetry wiki defines a trace as “track[s] the progression of a single request, called a trace, as it is handled by services that make up an application.”
Simply put, a trace is the recording of a request as it goes through a system. And the tracking of every service the request comes in contact with is called a span.
Let’s look at an example based on the Google Hipster Shop. Here is an architectural graph of the online shop:

When the CheckoutService calls the CartService, it will look at the request header to get the trace context. The trace context holds the tracing information to glue all the spans together.
The CheckoutService can create a new span that has a name and a time stamp. For example:
API CheckoutService call 00:10
The CartService receives the request and collects the trace context to add its span for whatever work it has to do. For example:
name: card details 00:09
It can then track the calls done on the database
DB CALL 00:02
And the task to process the data: Process data 00:07
The trace is then sent to a collector.
Trace context is information that links all the spans together to create a trace. But spans also contain information, it has a name, a start, and an end time. Furthermore, they have attributes that have more details related to the technology, i.e.:
-
Http: http.method, http.status_code
-
Database: db.type, db.instance, db.statement
-
Messaging: messaging.system,n messaging.destination
-
...
Go to the OpenTelemetry wiki page to learn more about traces.
# What is a metric?
Simply put, a metric is a measurement captured at runtime.
OpenTelemetry has three metric instruments:
-
Counter: a value that is summed over time (similar to the Prometheus counter)
-
Measure: a value that is aggregated over time (a value over some defined range)
-
Observer: captures a current set of values at a given time (like a gauge in Prometheus)
Like traces, context is also important in the metric’s information, alongside its name, description, unit, kind (counter, observer, measure), label, aggregation, and time.
# What are logs?
A log is a timestamped text record with metadata, either structured (recommended) or unstructured. Logs are currently still under construction at OpenTelemetry, but they will be there soon!
# OpenTelemetry components
Now, let’s look at the components that are part of OpenTelemetry. As mentioned above, we will touch upon the Collector and the Client library.
# What is the OpenTelemetry Collector?
The OpenTelemetry Collector offers a vendor-agnostic implementation of how to receive, process and export telemetry data. It removes the need to run, operate, and maintain multiple agents/collectors. (source: OpenTelemetry Wiki)
The collector is not required, but it is very flexible in deployment. You can either deploy it as an agent or as a gateway. The difference is that as an agent, the collector instance runs with the application on the same host (sidecar container, daemonset ...etc.). One or more collector instances run as a gateway as standalone services per cluster, datacert, and region.
It’s recommended to choose the agent deployment for new applications and use the gateway deployment for existing ones. In the case of Kubernetes, it will be deployed as a daemonset (agent mode).
The collector comprises three components that are enabled through a pipeline:
-
Receiver to get data into the collector, sent by either push or pull
-
Processor to decide what to do with the data received
-
Exporter to decide where to send the data, done by either pull or push

Extensions for the collector
The collector is also compatible with certain extensions.
Traces
-
Processors: attributes, batch, queued retry, resource, sampling, and span.
Metrics
-
Receivers: OTLP, Host, Prometheus
-
Exporters: OTLP, Prometheus
It’s also possible to use and create community-based components that can enhance and extend your collector pipeline. For example, we could create a dedicated exporter for a solution of our choice that will receive and ingest the metrics, the traces, and the logs.
# How to configure the pipeline
The pipeline is defined through the otel-collector-conf.yaml, which is usually stored in Kubernetes in the config map.
Here is the pipeline that we used during our episode related to Kubernetes events:
            receivers:
 otlp:
 protocols:
 grpc:
 endpoint: 0.0.0.0:55680
 http:
 endpoint: 0.0.0.0:55681
exporters:
 otlphttp:
 endpoint: "TENANTURL_TOREPLACE/api/v2/otlp"
 headers: {"Authorization": "Api-Token DT_API_TOKEN_TO_REPLACE"}
 logging:
 loglevel: debug
 sampling_initial: 5
 sampling_thereafter: 200
service:
 pipelines:
 traces:
 receivers: [otlp]
 processors: []
 exporters: [otlphttp,logging]
You can see that in the code we have defined OTLP as a receiver, OTLP/HTTP as an exporter, and a specific protocol.
OpenTelemetry uses two types of communication protocols:
-
Otlphttp (which is Protobuf)
-
grpc
Depending on the protocol supported by your third party solution that will store the traces, you'll need to use the collector to convert the format and the protocol to be able to ingest it in your target.
# What is the Client library in OpenTelemetry?
The client library in OpenTelemetry is also known as the instrumentation library. Applications need to have an OTel library to collect manual or automatic instrumentation.
Here’s a list of languages that OpenTelemetry currently supports:
-
C++
-
.net
-
erlang/elixir
-
GO
-
Java
-
JavaScript/Node.js
-
PHP
-
Python
-
Ruby
-
Rust
-
Swift
Most of these libraries support automatic instrumentation that requires you to load the right dependency. You have to configure the connection to the collector through environment variables or system properties.
For most of the supported languages, automatic instrumentation means that it will attach a specific library to your application's runtime and inject bytecode to capture OpenTelemetry from several popular libraries and frameworks. It won’t instrument any of your custom code automatically, it has to be done manually. (Learn more about supported frameworks in the OpenTelemetry Docs).
Manual instrumentation
You'll code the settings in manual instrumentation to interact with your OpenTelemetry collector. You have to specify:
-
Data source
-
Exporter
-
Propagator
-
Ressource
This is how you add dependencies. For example, Java would add Maven or Gradle. A new library in your code will allow you to configure the communication with the collector and define which traces or metrics you’d like to collect.
# Supported languages
Here is a table showing what each language currently supports:
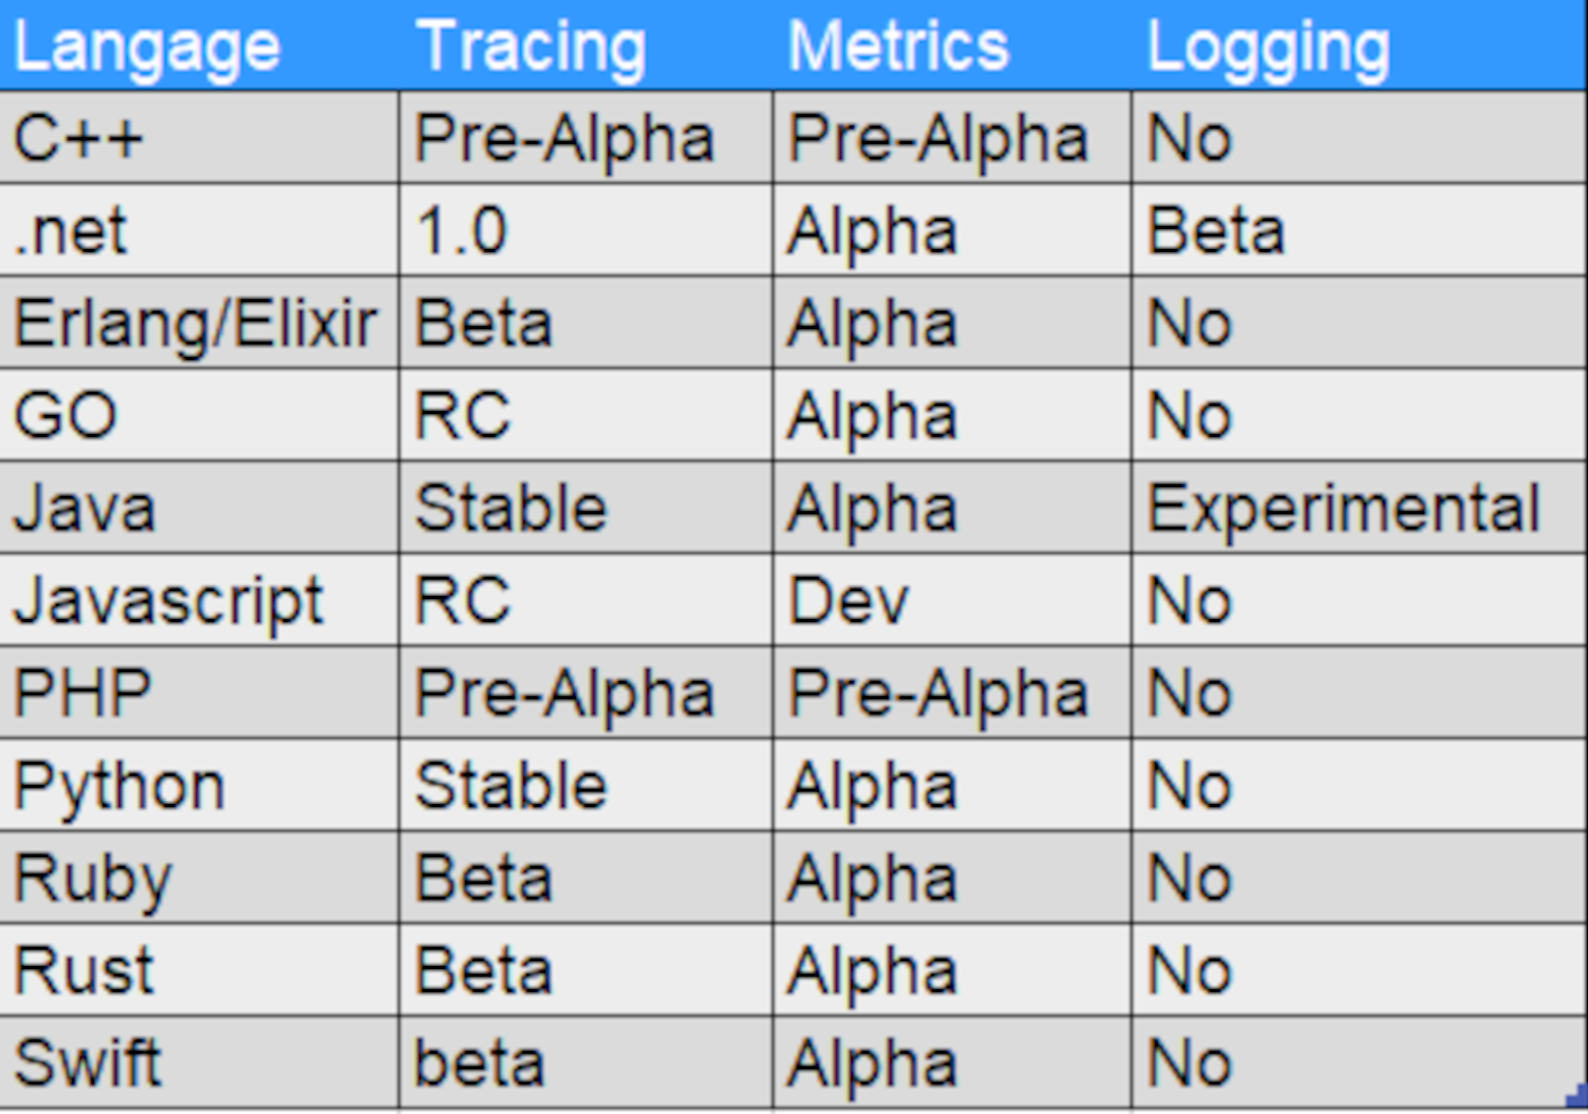
As you can see, many of them are in the Alpha or Pre-Alpha version, and very few are stable. The most advanced ones are .net and Java, starting with developing support for logging.
# Get started with OpenTelemetry
Projects like OTel are a great way to make your observability sustainable and adaptable long term, with the help of standardization. The OpenTelemetry community is large, and anybody can become a contributor or a user to make this great standard even more valuable.
Now that you have an overview of what OTel is, what benefits it brings, and how it works, you can get started by going on the OpenTelemetry website or their GitHub project page.
Table of Contents
- What is OpenTelemetry?
- Why OpenTelemetry?
- OpenTelemetry Data Collection
- OpenTelemetry components
- What is the OpenTelemetry Collector?
- Get started with OpenTelemetry
Topics
Go Deeper
Go Deeper


