OpenTelemetry
What is continuous profiling, and what is Pyroscope?
Pyroscope is an open source solution that provides continuous profiling, an effective way of learning where resources are consumed the most by a component, method, or line of code in production

Giulia Di Pietro
Jan 10, 2023
9 minute read


Pyroscope is an open source solution that provides continuous profiling, an effective way of learning where resources are consumed the most by a component, method, or line of code in production. In this blog post, I'll:
-
Introduce continuous profiling
-
Describe Pyroscope and how it works
-
Explain its integration with OpenTelemetry
-
Explain exported metrics and agents running in pulling mode.
As usual, the article will finish with a tutorial to immediately get you started with Pyroscope.
If you’d like to learn more about Pyroscope, watch the video on my YouTube channel, which includes an interview with Ryan Perry, co-founder of Pyroscope.
Let’s get started!
# What is continuous profiling?
To understand continuous profiling, you need to understand observability, which is the ability to precisely receive different kinds of data to understand a current situation.
Today, when we refer to observability, we expect to see the following signals:
-
Logs
-
Metrics
-
Traces
-
Exceptions
-
Events
-
Continuous profiling
Profiling has always existed and is supported by traditional APM solutions on the market. However, profiling has significantly changed over the last few years. 15 years ago, profiling generated so much overhead on our application that its use was limited to dev environments to understand what consumed CPU or memory.
Initially, a profiler would require starting a recording to collect stack traces or memory dumps while interacting with an application. Once the recording stopped, the recorded data were analyzed to point out potential issues in our code.
This approach was very beneficial but time-consuming, and it didn’t provide any automated process. You had to analyze data manually. The most challenging part was simulating the right application action to get the right profile.
In 2010, Google released a paper titled “Google Wide profiling: A continuous profiling infrastructure for data centers” where they made a case for the value of adding continuous profiling to your applications. Continuous profiling in production lets you capture the right interaction to analyze stack traces over time. So it means that we're continuously collecting profiles out of our code.
Profilers collect samples every 10s, and the system only collects the stack trace, frequently called, to focus on the most important things. This helps you deal with smaller volumes of data, and the recording captures the data slightly differently to reduce the overhead. Today the overhead of profilers is around 1% and less than 9%.
The big advantage of continuous profiling is comparing profiles over time. For example, adding profile comparisons to your CI/CD processes.
To take advantage of continuous profiling, you need to:
-
Instrument your code by adding the profiler that starts the profile at the init of the code
-
Deploy a profiling storage that will receive all the profiles generated from your code
-
Select a profiling visualization tool to help you analyze the data collected.
Profiling has changed due to the work of community engineers like Brendan Gregg, who introduced a new way of visualizing profiling: FlameGraph. FlameGraph shows which part of the code consumes the most resources.
For example:

With this FlameGraph, you can understand that you're spending around 50% in CheckProduct and ProductResponse, and 60 % of each function are consumed in FlagProduct and the GenerateResponse methods. By optimizing both methods, we can reduce CPU time.
Every language of the industry has its own set of profilers, for example:
-
Golang pprof
-
Ruby rbspy
-
Python py-spy
-
Rust pprof-rs
-
.Net dotnet trace
-
Php phpspy
Those profilers need to be added to your code to profile the instruction of your program.
But there is a technology today that can achieve profiling without the need to adapt your code: eBPF. If you want to learn more about eBPF, check out the introduction to eBPF.
With eBPF profiling, you load a probe in the kernel that will collect your code instructions. eBPF profiling is exciting because it could reduce the overhead of profiling even more.
When producing a continuous profile, you have the ability to attach a tag to your profile.
Tag is a great feature because you can assign a specific method or function and a specific tag. With this tag, you can then be able to filter the collected profile and find the right instruction related to your code.
pprof.Do(context.Background(), pprof.Labels("controller", "slow_controller"), func(c context.Context) { slowCode()})
-
Go
-
Java
-
PHP
-
NodeJS
-
Ruby
-
Python
-
Rust
-
And Kernel instruction with eBPF.
What makes Pyroscope unique is the ability to ingest profiles from the Pyroscope Agents and any profiler on the market.
Out of continuous profiling, Pyroscope also provides the ability to do “Adhoc profiling,” where you can upload a pprof, JSON file, or collapsed format and visualize your profile in Pyroscope.
Pyroscope provides a storage engine that will time aggregate the data efficiently to keep details without too much storage. If you want to learn more about how Pyroscope stores the data, check their documentation on storage engine design.
Pyroscope is combined of:
-
A server displaying the various profiles collected
-
The agents: the components that you deploy close to your code to collect profiling data.
And it can be installed in Linux, macOS, Docker, and Kubernetes.
In the case of Kubernetes, Pyroscope provides a helm chart allowing you to add extra features to your standard deployment. By default, Pyroscope deploys a k8s deployment with one pod for the Pyroscope server designed to ingest profiles, providing a web UI to analyze the traces and a Prometheus endpoint.
To get profiles in Pyroscope, you'll need to deploy the Pyroscope agents, the easiest being the eBPF agent. Pyroscope provides one specific helm chart to deploy the Pyroscope eBPF agent.
In the end, the Pyroscope eBPF agent will be deployed as a Daemonset to deploy the eBPF probe on each node of your cluster. It will collect CPU time related to all the objects in this node and add tags related to your Kubernetes objects: pod, node, namespace, and Kubernetes labels like version, application name, etc.
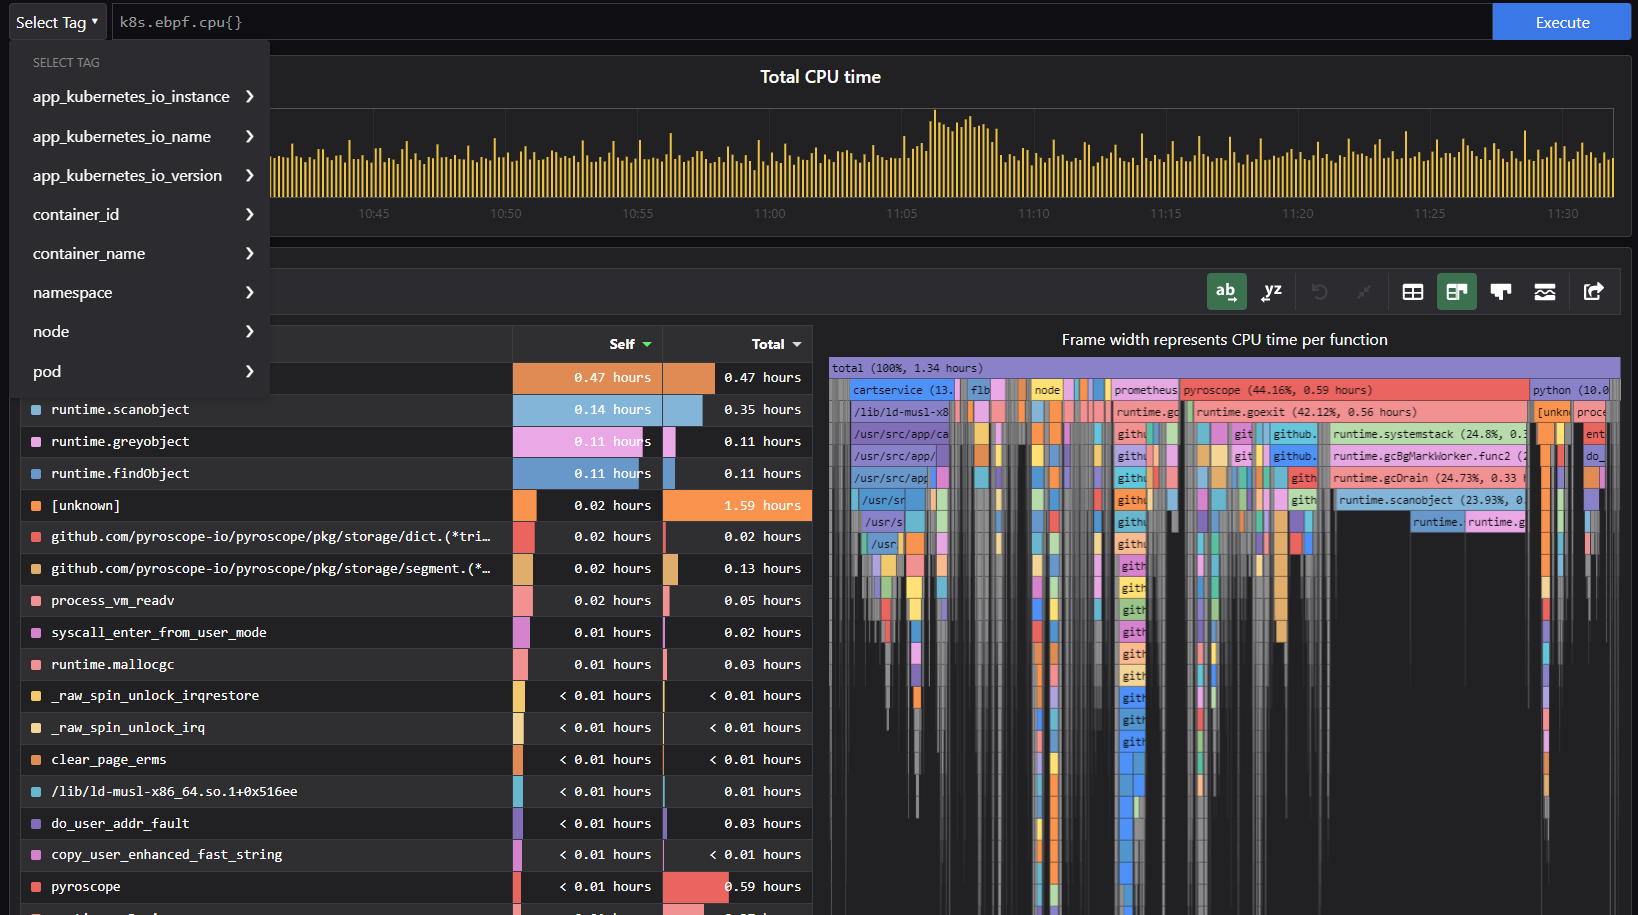
If you're looking for a specific application profile for your application code, you can also use one of the available agents of Pyroscope for GO, Nodejs, Python, etc.
There are two types of agents:
-
Agents that you attach to the library or process of your application (as in the case of Java, .Net, and PHP)
-
Agents that you need to add in the init of your code (like in Go)
Pyroscope.Start(Pyroscope.Config{
ApplicationName: "checkoutService.otel-demo",
// replace this with the address of Pyroscope server
ServerAddress: Pyroscope_server,
// you can disable logging by setting this to nil
Logger: Pyroscope.StandardLogger,
// optionally, if authentication is enabled, specify the API key:
// AuthToken: os.Getenv("Pyroscope_AUTH_TOKEN"),
// you can provide static tags via a map:
Tags: map[string]string{"hostname": os.Getenv("HOSTNAME")},
ProfileTypes: []Pyroscope.ProfileType{
// these profile types are enabled by default:
Pyroscope.ProfileCPU,
Pyroscope.ProfileAllocObjects,
Pyroscope.ProfileAllocSpace,
Pyroscope.ProfileInuseObjects,
Pyroscope.ProfileInuseSpace,
// these profile types are optional:
Pyroscope.ProfileGoroutines,
Pyroscope.ProfileMutexCount,
Pyroscope.ProfileMutexDuration,
Pyroscope.ProfileBlockCount,
Pyroscope.ProfileBlockDuration,
},
})
Similarly to the traditional profiler, Pyroscope agents also allow you to tag parts of your code:
// these two ways of adding tags are equivalent:Pyroscope.TagWrapper(context.Background(), Pyroscope.Labels("controller", "slow_controller"), func(c context.Context) { slowCode()})
When configuring your agents, you'll always need to specify the application name and the Pyroscope URL. The application name is key because the data will be stored under the application.
Otherwise, the big value of Pyroscope is related to the web UI and the usage of tags.
Pyroscope provides a query language similar to PromQL named FlameQL, allowing you to filter profiles based on tags.
<application_name>{[<tag_key>=<tag_value>[,<tag_key>=<tag_value>]]}]
In terms of the operator on the tags, FlameQL supports the following:
-
= a tag value must be exactly equal to the provided string
-
=~ a tag value must regex-match the provided string
-
!= a tag value must not be equal to the provided string
-
!~ a tag value must not regex-match the provided string.
In the Pyroscope UI for continuous profiling, the tag explorer shows you the distribution of profiles on a given tag, the average latency, and the standard deviation.

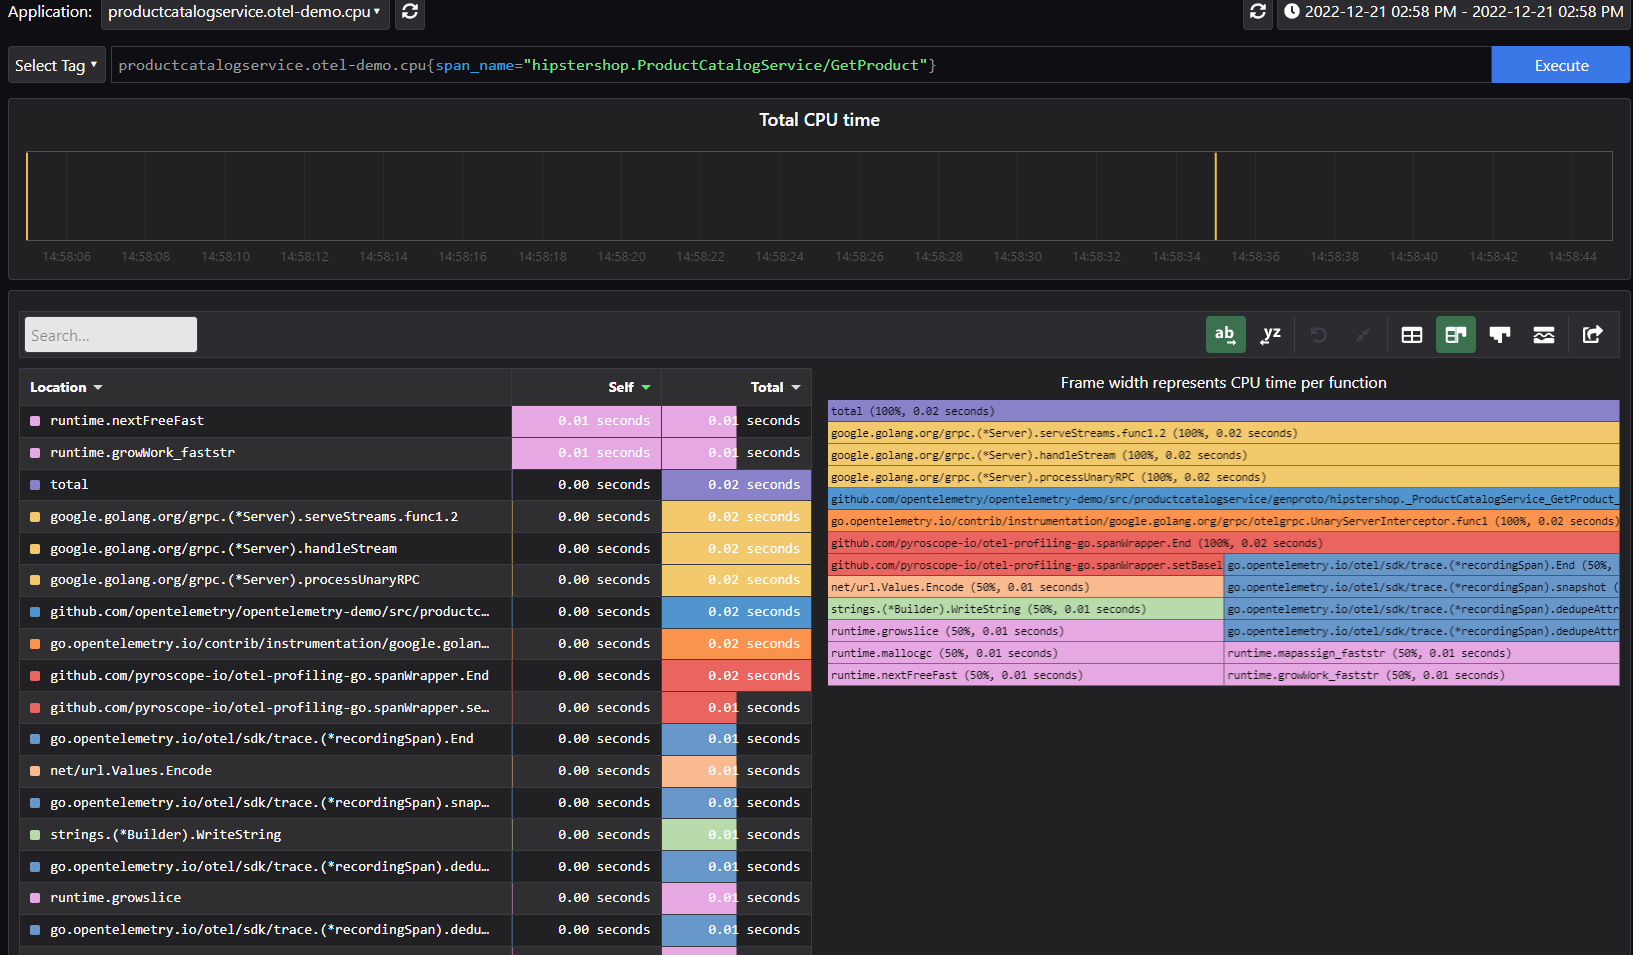
The single view allows you to type a FlameQL to look precisely at a given profile. You also have the option to add annotations to mark a given profile.

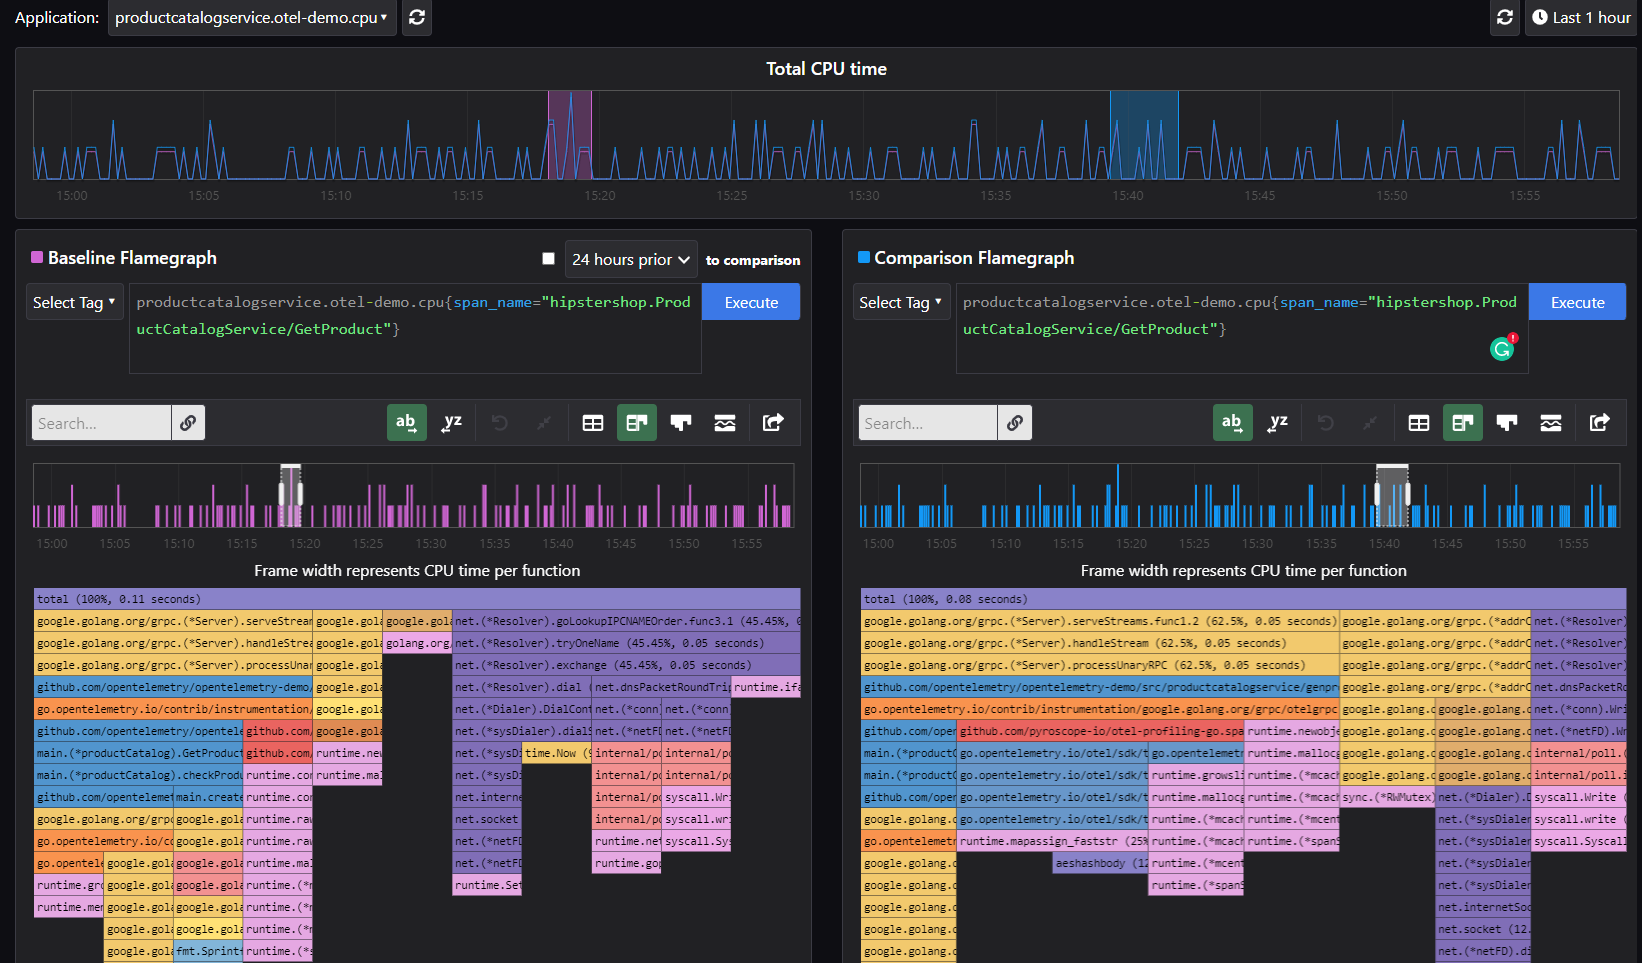
In the comparison view, you can compare two FlameQLs on two different timelines to compare the produced profile. For example, you can see an increase in CPU time:
Pyroscope provides a couple of interactions with observability solutions, and it integrates well with OpenTelemetry.
# Pyroscope OpenTelemetry integration
One of the most efficient integrations is the OpenTelemetry integration, currently only available for Go, Java, and Ruby.
Once the Pyroscope agent runs, you can link the profiler to the trace provider used within your code. The integration's value is adding extra span attributes to the produced span linking the single view profile, comparison view profile, and more to the produced span.
With this integration, you can start troubleshooting by looking at a trace and then drilling down to the code with the help of the link to the profiling data of a particular span.
How can you take advantage of this?
Pyroscope provides a Pyroscope OpenTelemetry library that you can use to define your trace provider.
otelPyroscope.NewTracerProvider(tp,
otelPyroscope.WithAppName("checkoutService.otel-demo"),
otelPyroscope.WithPyroscopeURL(Pyroscope_server),
otelPyroscope.WithRootSpanOnly(true),
otelPyroscope.WithAddSpanName(true),
otelPyroscope.WithProfileURL(true),
otelPyroscope.WithProfileBaselineURL(true),
))
In this example, tp is our initial OpenTelemetrytrace provider:
tp := sdktrace.NewTracerProvider(
sdktrace.WithBatcher(exporter),
)
Finally, you attach the Pyroscope OpenTelemetry library to the OpenTelemtry SDK with the following instruction:
otel.SetTracerProvider(otelPyroscope.NewTracerProvider(tp,
otelPyroscope.WithAppName("checkoutService.otel-demo"),
otelPyroscope.WithPyroscopeURL(Pyroscope_server),
otelPyroscope.WithRootSpanOnly(true),
otelPyroscope.WithAddSpanName(true),
otelPyroscope.WithProfileURL(true),
otelPyroscope.WithProfileBaselineURL(true),
))
Once the integration is enabled, the profile will have extra tags on the generated profiles:
-
profile_id="<spanID>" that can help us to filter to a specific span
-
span_name="ExampleSpan" to filter to a specific span name
As mentioned, this integration will also add extra information on your span attributes:
-
Pyroscope.profile.id - is set to span ID to indicate that profile was captured for a span
-
Pyroscope.profile.url - contains the URL to the FlameGraph in Pyroscope UI
-
Pyroscope.profile.baseline.url - contains the URL to the baseline comparison view in Pyroscope UI.
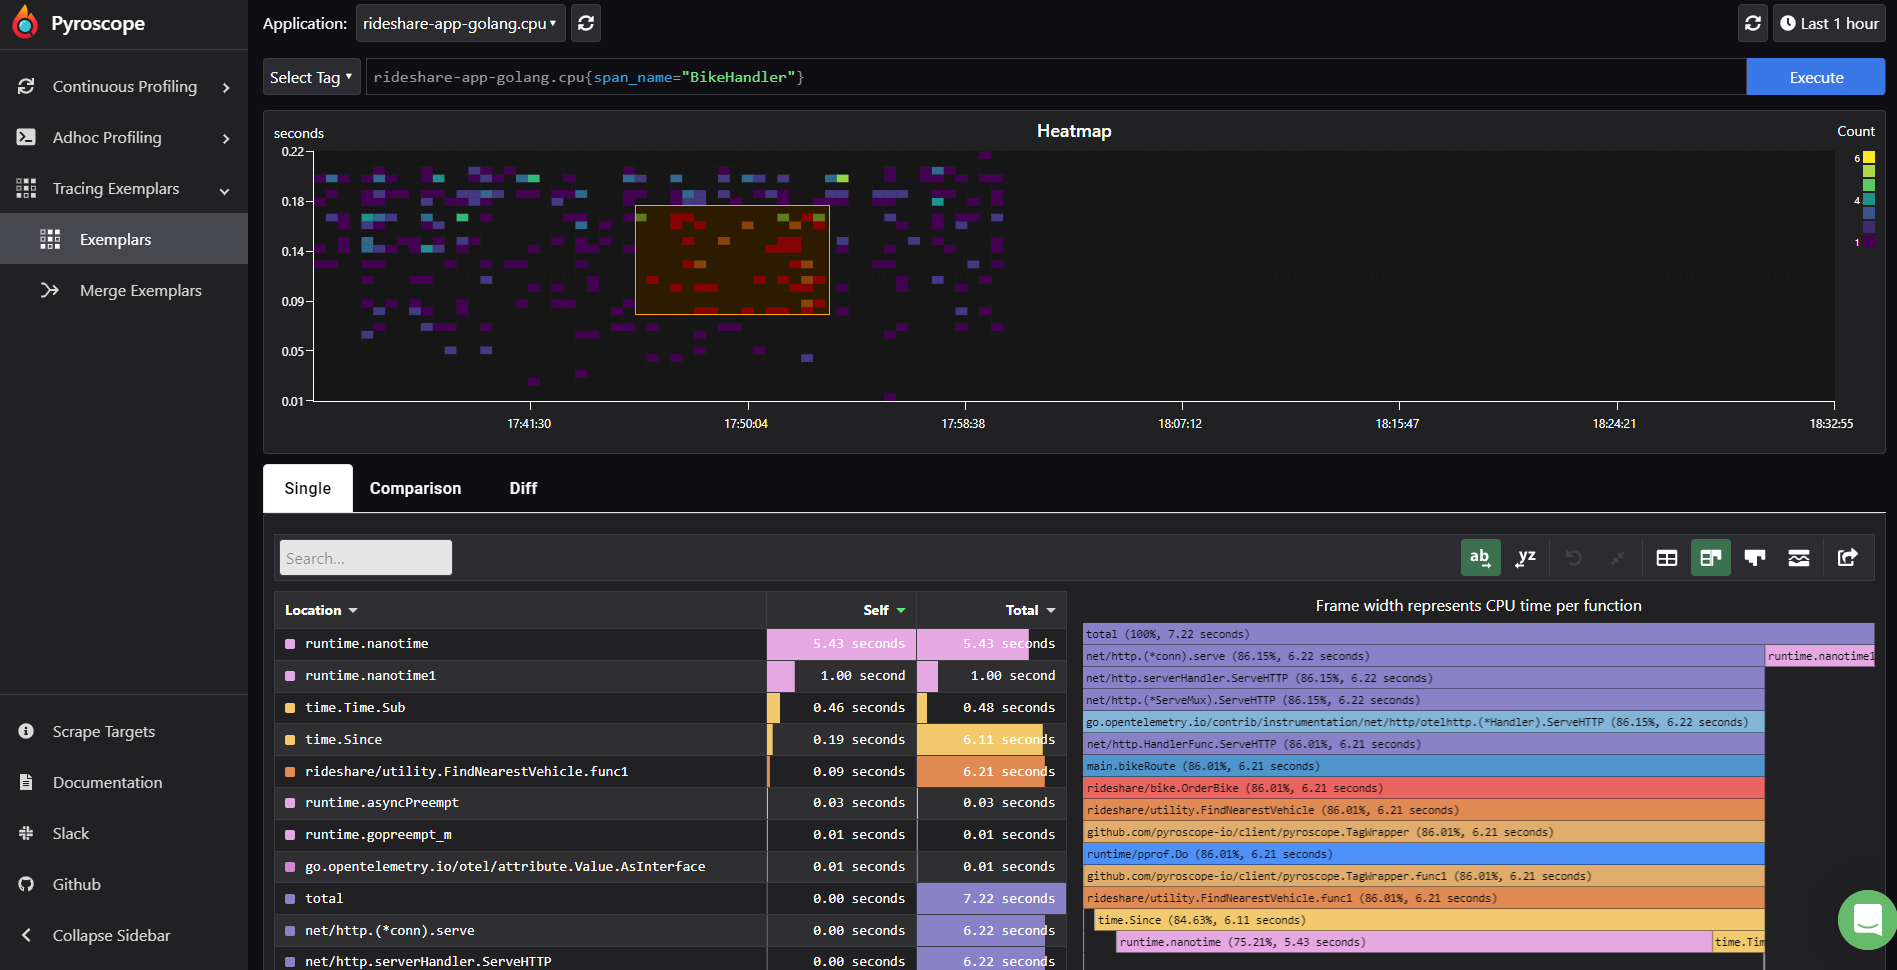
Pyroscope also provides a feature currently available on the Pyroscope cloud: tracing exemplars. This feature will be available on the open source version beginning next year.
Where it will show us all the profiles generated linked to spans.
# Pyroscope metrics
Pyroscope provides the ability to export metrics from the profiling agents. Currently, this feature requires changing the configuration of your Pyroscope server by adding the following settings:
metrics-export-rules:
Metric export rules will generate Prometheus metrics exposed from the Pyroscope agents on the endpoint: /exported-metrics
To generate metrics, specify a metric name and how Pyroscope will retrieve the information. For example:
productcatalogservice_oteldemo_byspan_cpu_seconds_total:
expr: "productcatalogservice.otel-demo.cpu{}"
Node: total
group_by: [span_name]
“Expr” is a FlameQL query to which you add group_by (or labels) to add a Prometheus label (the span_name in this case) on the produced metrics.
“Node” specifies with which part of the profile you’d like to produce the metric. “total” corresponds to the entire profile, but you can filter to select a specific node of your profile.
# Pyroscope agents running in pulling mode
The default mode of collecting the profile from the agents is “push,” where the various agents push the profile data to the Pyroscope server. You need to specify the server address in your Pyroscope agent.
But there is a way of changing this by enabling the pulling mode, which means that the Pyroscope server will collect the profile on the agent.
The pulling mode requires modifying the configuration of Pyroscope by adding scrap_configs.
A few profilers support the pulling mode, exposing a port on the application to let a Pyroscope collect the profiling data. Pprof would be the best example.
Of course, you need to enable the listener on your application to make the pulling mode port accessible.
You can configure the scrap config statically or dynamically. Similarly to Prometheus, static requires you to specify the URL of the agent. For example,
scrape-configs:
- job-name: Pyroscope
enabled-profiles: [cpu, mem, goroutines, mutex, block]
static-configs:
- application: productcatalogservice.otel-demo
spy-name: gospy
targets:
- example-productcatalogservice.otel-demo.svc:6060
- application: checkoutService.otel-demo
spy-name: gospy
targets:
- example-checkoutservice.otel-demo.svc:6060
If you have several workloads configured in pulling mode in your k8S cluster, you can set up a service discovery similar to Prometheus. You need to add the following part to the Pyroscope server configuration:
- job-name: 'kubernetes-pods'
enabled-profiles: [ cpu, mem ]
kubernetes-sd-configs:
- role: pod
relabel-configs:
- source-labels: [__meta_kubernetes_pod_annotation_Pyroscope_io_scrape]
action: keep
regex: true
- source-labels: [__meta_kubernetes_pod_annotation_Pyroscope_io_application_name]
action: replace
target-label: __name__
- source-labels: [__meta_kubernetes_pod_annotation_Pyroscope_io_scheme]
action: replace
regex: (https?)
target-label: __scheme__
- source-labels: [__address__, __meta_kubernetes_pod_annotation_Pyroscope_io_port]
action: replace
regex: ([^:]+)(?::\d+)?;(\d+)
replacement: $1:$2
target-label: __address__
- action: labelmap
regex: __meta_kubernetes_pod_label_(.+)
- source-labels: [__meta_kubernetes_namespace]
action: replace
target-label: kubernetes_namespace
- source-labels: [__meta_kubernetes_pod_name]
action: replace
target-label: kubernetes_pod_name
- source-labels: [__meta_kubernetes_pod_phase]
regex: Pending|Succeeded|Failed|Completed
action: drop
- action: labelmap
regex: __meta_kubernetes_pod_annotation_Pyroscope_io_profile_(.+)
replacement: __profile_$1
Add the following annotation to your workload:
            Pyroscope.io/scrape: "true"
Pyroscope.io/application-name: "redis"
Pyroscope.io/profile-cpu-enabled: "true"
Pyroscope.io/profile-mem-enabled: "true"
Pyroscope.io/port: "6060"
# Pyroscope tutorial
In this tutorial, we will use Pyroscope with the OpenTelemetry Demo, which is the best way to show how to use Pyroscope with:
-
The Pyroscope eBPF agent
-
The Pyroscope Go agent
-
.Net agent
-
Python agent
-
Java agent
-
Ruby Agent
In all the languages supporting the OpenTelemetry integration, we will add the OpenTelemetry integration on top of the Pyroscope agent on the service using Golang, Java, and Ruby.
I'll show you how to add the Pyroscope agent, see the meaningful information in Pyroscope, and link traces to profiling.
For this tutorial, you'll need:
-
A Kubernetes cluster
-
The OpenTelemetry operator with the certmanager
-
The Nginx ingress controller
-
A Dynatrace tenant
-
The OpenTelemetry Demo application
-
The Pyroscope server and the eBPF agent
Watch the full video tutorial here on my YouTube channel (including an interview with Ryan Perry, co-founder of Pyroscope): What is Continuous Profiling, and what is Pyroscope?
Or follow the tutorial on GitHub: What is continuous profiling and what is Pyroscope
Table of Contents
- What is continuous profiling?
- What is Pyroscope?
- Pyroscope OpenTelemetry integration
- Pyroscope metrics
- Pyroscope agents running in pulling mode
- Pyroscope tutorial
Topics
Go Deeper
Go Deeper


