Service mesh
What is Service Mesh and, especially, what is Istio?
Service mesh is a great technology that improves how services communicate in a microservice architecture. A service mesh like Istio can be leveraged for better observability and insights into your microservices. Let’s look at how and why in this blog post.

Giulia Di Pietro
Jan 20, 2022
8 minute read


This blog post is part of a Kubernetes series to help you initiate observability within your Kubernetes cluster. It also summarizes the content presented on the “Is it Observable” episode: What is ServiceMesh and especially what is Istio?
Microservices have been a hot topic for several years, and alongside them, we have seen the creation of multiple types of frameworks to help build their architecture. The service mesh has become quite popular in microservice architecture. Described as “a dedicated infrastructure layer for facilitating service-to-service communications between services or microservices”. Service meshes help you provide extra observability on your cluster, and popular ones include Linkerd, Istio, Consul, Kuma, and Maesh.
In this blog post and related tutorial, we’ll be focusing on Istio. However, before we jump into it, I’d like to introduce microservice architecture and service meshes in general. This will help you understand the context before we learn more about Istio and get into the tutorial. If you’d like to jump to the tutorial, click on GitHub.
# Introduction to microservice architecture
As already mentioned, microservices have grown in popularity in the past few years, and it’s not surprising. They bring a lot of benefits compared to traditional monolithic software:
-
Easier to build
-
Independent deployment
-
Technology diversity
-
Easier to scale development
-
Natural stack to move to the cloud
When building a service-based architecture, there are several things we need to consider regarding communication.
Let’s look at the example of our Google Hipster Shop that we usually use for our tutorials. (Which is a straightforward example of an online store built on microservices).
We have a Frontend service that communicates with
-
ProductCatalogService
-
ShippingService
-
RecommendationService
-
CartService
-
Etc.

To let our services communicate with each other, there are multiple things that we have to manage:
1. The retry logic
-
If the cart service can't reach the payment service, you can add a retry logic in your code to handle the exception and retry the request several times.
-
But then, the question is how often I should retry to be efficient and avoid putting extra pressure on our system.
-
Putting the retry logic in the code is good, but you need to ensure that all the various services built in other languages also have implemented a retry logic.
2. The authentication logic
-
If a cart service needs to communicate with the payment service, it needs to know the authentication mechanism to use to communicate with it. And the payment service needs to have the authentication layer in the code.
3. The certificate management
-
To increase the security within our cluster, we may also want to communicate using SSL/TLS instead of plain HTTP and generate specific certificates for each of our services. It will mean that it will add extra tasks to our K8S administrator. They will need to rotate those certificates regularly to guarantee a good level of security.
4. Observability
-
We probably want to expose metrics to our services to know:
How many request/s happen
The current latency
The number of errors and HTTP codes
Who is calling my service
Etc…
So we can add the logic that will expose metrics in our service code, using, for example, the Prometheus client. Our service will also become a Prometheus exporter, and we will be able to monitor our service usage with the help of a dashboard and alerting rules.
-
We will probably also want to add tracing to understand why our response time has increased. Especially if you have a situation where the frontend service calls the recommendation service, the product catalog service, and the cart service. If our response time is 1,5s, we will probably want to know where we spent this time in the recommendation service, the product catalog service, or the cart service. To enable tracing, we can also add libraries and the instrumented code that will allow us to get traces, but then we will need to ingest them to store them somewhere.
5. Traffic split
-
You probably want to implement canary releases where a small portion of your users will utilize the fresh new version of your service. You can define a traffic split that will send 90% of the traffic to the service in version 2 and 10 % to your new version. Implementing this in your application is usually very complicated and time-consuming.
6. Security logic
-
You probably have an ingress that will send the traffic to your main service. But once inside your cluster, you can reach out to any service without restriction. From a security perspective, if a Hacker can enter your cluster, your data will probably be sniffed out of your cluster. So, can we also add security logic to our cluster? We can add the logic directly to our service.
To sum it all up, we would need to:
-
Build in the application logic
-
Then add in top of that the retry logic
-
The authentication logic
-
The TLS/SSL certificates
-
The logic to instrument our application to expose metrics and traces.
-
The traffic split logic as well…..
Soon, it will mean we're spending only 40-60% of our development effort on features to add more business logic. The rest is spent adding all that logic. And then, we also have to maintain all that code!
To avoid those extra tasks, we should use Service Mesh technology.
# What is “service mesh”?
Service mesh is a dedicated infrastructure layer to facilitate service-to-service communication.
Service mesh will make your communication smarter because it manages for you:
-
The retry logic
-
The traffic split and canary releases
-
The authentication logic
-
The certificate management
-
The observability layer
The main idea is to “put all the communication” in a sidecar proxy.
If we only focus on building the logic related to our service, the sidecar proxy will manage the communication layer for us.
So, what is a sidecar proxy? The service mesh has several architecture components, one of which is a control plane in charge of managing the communication of your service. The control plane will automatically inject an extra container into the definition of our pods by adding a proxy.
This mechanism is called a “sidecar proxy.”
Once the proxy is installed, our service won’t communicate directly to other services anymore.
In our example, the frontend service will send the request to the sidecar proxy that will then reach out to the sidecar proxy of the cart service that will forward the request on localhost to the cart service.
The sidecar has the proxy configuration that will allow us to turn on
-
The retry logic
-
The certificate (and rotate them),
-
The authentication
-
And the default metrics exposure for our service.
Without adding any extra line of code to our service.
Because the sidecar proxy is managed and injected by the control plane, we only have one location to configure. The control plane will manage the network layer and all the proxies added to our pods.
There are several service mesh solutions, but today we will be looking at Istio, one of the most popular.
# What is Istio, and how does it work?
Istio is a service mesh that utilizes in its architecture Envoy Proxy as a sidecar proxy and istiod (d is for daemon) as a control plane that allows us to configure, discover, and manage our certificates.
# How to configure Istio?
To configure Istio, you should start by avoiding changing your K8s deployment files by adding communication logic. Instead, you should separate the logic by defining the communication in specific CRD (custom resource definition) files that extend the Kubernetes API.
These new CRDs help you manage traffic routing, retry logic, and configure which services to communicate with.
There are two main types of CRD:
-
1
VirtualService, that will define how to route the traffic to a specific destination.
-
2
DestinationRule, that will configure the policy of that traffic (like a load balancer).
Those two CRDs will be consumed by istiod to translate to specific Envoy settings.
Then Istio pushes the changes to all your Envoy proxies. This means that the Envoy proxies don't have to communicate with istiod to route the traffic.

Istiod is composed of several components: Pilot, Citadel and Galley

There used to be more separate components, but they're now directly added to istiod.
-
Pilot is responsible for configuring the proxies at runtime
-
Citadel is responsible for certificate issuance and rotation
-
Galley responsible for validating ingestion, aggregating, transforming and distributing config within Istio
Istiod also has a dynamic service discovery, and an internal registry for services and their endpoints. When you deploy a new service, it will automatically register in Istio. With the help of this registry, the envoy proxy will know how to root the traffic to the relevant services.
Istiod also acts like certificate management, gets tracing and metrics from the Envoy proxy, and exposes it in Prometheus.

The tracing and metrics are generated out of the box—no need for extra coding or instrumenting.
Istio also has an Ingress Gateway. It’s the entry point for our cluster and an alternative to NGINX Ingress Controller.
The Gateway will redirect the incoming traffic to one of our services using VirtualService. The traffic will look like this:

The request will hit the Gateway, which will evaluate the virtual service rules on how to route the traffic. Then it will reach out to the Envoy proxy and forward the traffic to the service using localhost.
If a service needs to communicate with another service, the envoy proxy will use the Virtual Service and Destination Rule to reach out to the next Envoy proxy.
The proxy will gather the metrics and tracing and will send it back to the control plane.
How to deploy Istio on Kubernetes
To deploy Istio on K8s, just follow those simple steps:
-
1
Install the IstioCtl for your CLI.
-
2
Use IstioCtl to install Istio core and istiod.
-
3
Launch the installation with an istiod install with a specific configuration profile. This will automatically create a dedicated namespace called istio-system that will have the istiod and the istio ingress gateway installed.
Tip: to enable automated discovery, label one of your namespaces with istio-injection=enabled
Istio has multiple add-ons to enable monitoring (Prometheus), tracing (Grafana), and visualization (Jaeger, Zipkin). That’s why there are several configuration profiles available, and you need to choose one when you install Istio.
Here’s a table with an overview of the available profiles. (The components marked as ✔ are installed within each profile)
-
Default: used for production usage
-
Demo: designed to run istio with limited resources
-
Minimal: will only install the control plane
-
External: to handle communication with a remote cluster
-
Empty: nothing will be installed
-
Preview: to deploy the experimental preview feature of istio
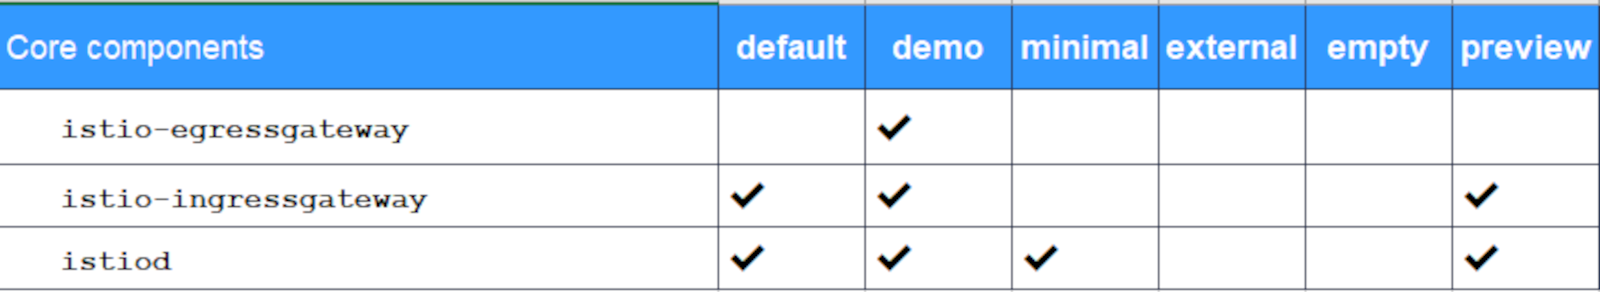
For our tutorial, we will install the demo mode to get all the features of Istio.
Tutorial: Getting started with Istio
Now that we have covered the basics of the service mesh, its role in a microservice architecture, and how to install Istio, let’s jump into the tutorial.
You can follow the tutorial in two ways:
-
Watching my YouTube video: What is ServiceMesh and specially what is Istio?
-
Reading the instructions on GitHub: K8s and service mesh (istio)
Table of Contents
- Introduction to microservice architecture
- What is “service mesh”?
- What is Istio, and how does it work?
Topics
Go Deeper
Go Deeper


